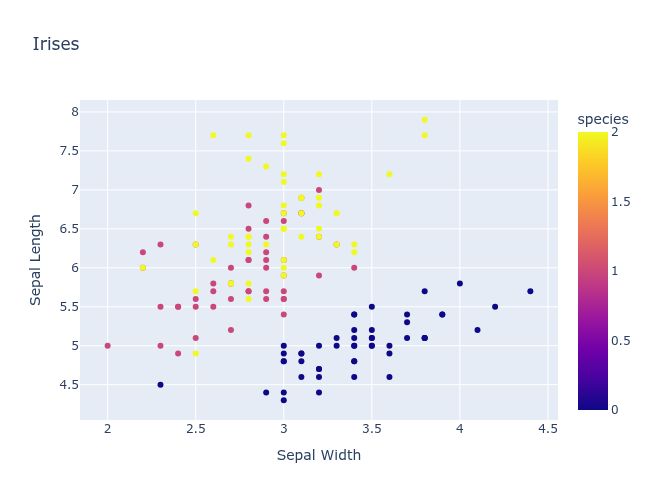
Plotting Polars Dataframes
Adapted from Polars visualization
Load Iris data
import polars as pl

path = "/home/bon/projects/auc/courses/ml/website/data/iris.csv"

df = pl.read_csv(
    path,
    new_columns=[
        "sepal_length",
        "sepal_width",
        "petal_length",
        "petal_width",
        "species",
    ],
)
print(df)
shape: (150, 5)
┌──────────────┬─────────────┬──────────────┬─────────────┬─────────┐
│ sepal_length ┆ sepal_width ┆ petal_length ┆ petal_width ┆ species │
│ ---          ┆ ---         ┆ ---          ┆ ---         ┆ ---     │
│ f64          ┆ f64         ┆ f64          ┆ f64         ┆ i64     │
╞══════════════╪═════════════╪══════════════╪═════════════╪═════════╡
│ 5.1          ┆ 3.5         ┆ 1.4          ┆ 0.2         ┆ 0       │
│ 4.9          ┆ 3.0         ┆ 1.4          ┆ 0.2         ┆ 0       │
│ 4.7          ┆ 3.2         ┆ 1.3          ┆ 0.2         ┆ 0       │
│ 4.6          ┆ 3.1         ┆ 1.5          ┆ 0.2         ┆ 0       │
│ 5.0          ┆ 3.6         ┆ 1.4          ┆ 0.2         ┆ 0       │
│ …            ┆ …           ┆ …            ┆ …           ┆ …       │
│ 6.7          ┆ 3.0         ┆ 5.2          ┆ 2.3         ┆ 2       │
│ 6.3          ┆ 2.5         ┆ 5.0          ┆ 1.9         ┆ 2       │
│ 6.5          ┆ 3.0         ┆ 5.2          ┆ 2.0         ┆ 2       │
│ 6.2          ┆ 3.4         ┆ 5.4          ┆ 2.3         ┆ 2       │
│ 5.9          ┆ 3.0         ┆ 5.1          ┆ 1.8         ┆ 2       │
└──────────────┴─────────────┴──────────────┴─────────────┴─────────┘
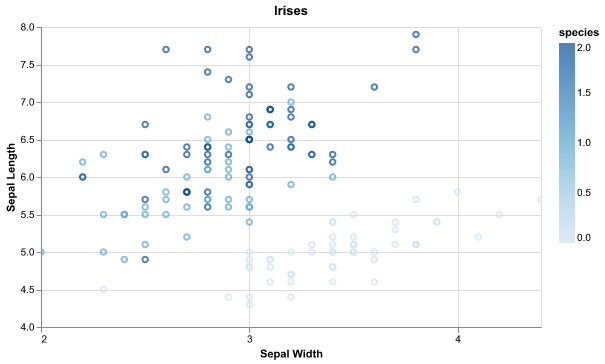
Altair
chart = (
    df.plot.point(
        x="sepal_width",
        y="sepal_length",
        color="species",
    )
    .properties(width=500, title="Irises")
    .configure_scale(zero=False)
    .configure_axisX(tickMinStep=1)
)
chart.encoding.x.title = "Sepal Width"
chart.encoding.y.title = "Sepal Length"
chart.save("images/iris-polars-altair.png")
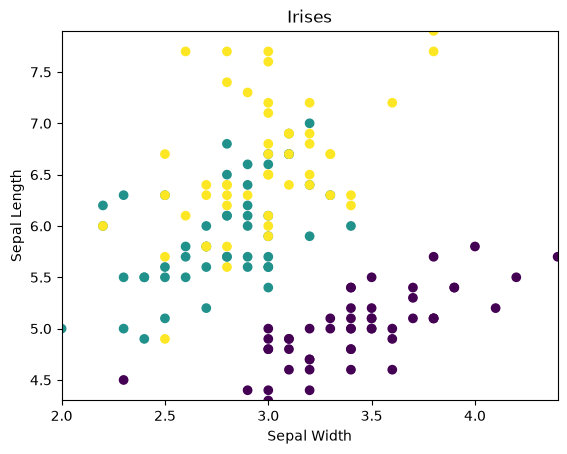
Matplotlib
ax.scatter does not reliably consume Polars series so we convert to numpy.
import matplotlib.pyplot as plt

# plt.clf()
fig, ax = plt.subplots()
ax.set_xlim(df["sepal_width"].min(), df["sepal_width"].max())
ax.set_ylim(df["sepal_length"].min(), df["sepal_length"].max())
ax.scatter(
    x=df["sepal_width"].to_numpy(),
    y=df["sepal_length"].to_numpy(),
    c=df["species"].to_numpy(),
)
ax.set_title("Irises")
ax.set_xlabel("Sepal Width")
ax.set_ylabel("Sepal Length")
plt.savefig("images/iris-polars-matplotlib.png")
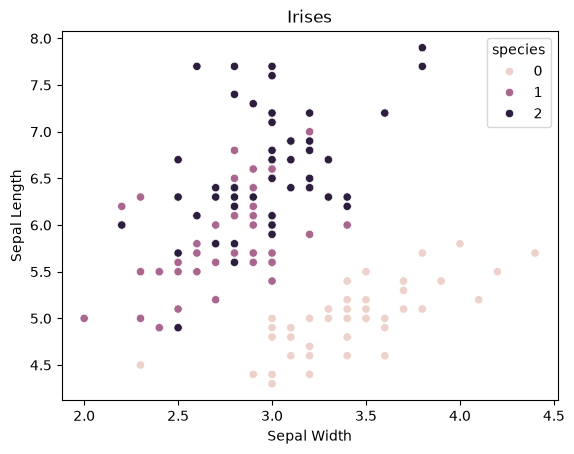
Seaborn
import matplotlib.pyplot as plt
import seaborn as sns

fig, ax = plt.subplots()
sns.scatterplot(
    df,
    x="sepal_width",
    y="sepal_length",
    hue="species",
    ax=ax,
)
ax.set_title("Irises")
ax.set_xlabel("Sepal Width")
ax.set_ylabel("Sepal Length")
plt.save("images/iris-polars-seaborn.png")
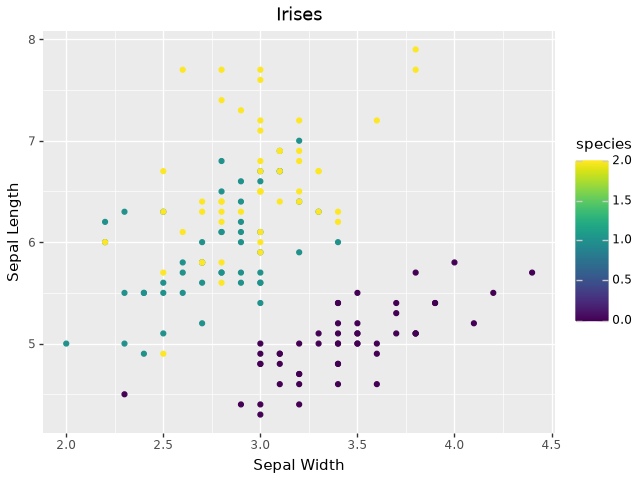
Plotnine
from plotnine import aes, geom_point, ggplot, labs

plot = (
    ggplot(df, mapping=aes(x="sepal_width", y="sepal_length", color="species"))
    + geom_point()
    + labs(title="Irises", x="Sepal Width", y="Sepal Length")
)
plot.save("images/iris-polars-plotnine.png")
Plotly
import plotly.express as px
from kaleido import write_fig_sync

plot = px.scatter(
    df,
    x="sepal_width",
    y="sepal_length",
    color="species",
    width=650,
    title="Irises",
    labels={"sepal_width": "Sepal Width", "sepal_length": "Sepal Length"},
)
write_fig_sync(plot, "images/iris-polars-plotly.png")